Md. Mizanur Rahman
Department of Community Medicine and Public Health, Universiti Malaysia Sarawak, Malaysia.
Neilson Richard Seling
Department of Community Medicine and Public Health, Universiti Malaysia Sarawak, Malaysia.
Andrew Kiyu
Department of Community Medicine and Public Health, Universiti Malaysia Sarawak, Malaysia.
Keywords: Stunting, Dietary diversity, Food security, Sarawak
DOI: 10.3329/bmrcb.v47i2.57770
Abstract
Background: Malnutrition among under-five children is one of the paramount public health concerns in the country.
Objectives: This study aimed to determine the relationship between under-five nutritional status and household dietary diversity (HDD) and household food security (HFS).
Methods: In this cross-sectional study analysed 808 under-five children’s data from 50 villages in five divisions of Sarawak using a multistage cluster sampling technique. Data were collected by face-to-face interview using interviewer-administered questionnaires. WHO Anthro version 3.2.2 was used for anthropometric, and IBM SPSS version 22.0 was used for multivariate data analysis.
Results: Multivariate analysis showed that children with low HDD were 1.68 times more likely to be stunted than those with high HDD. Children from households with food insecurity but without hunger were 3.86 times and with hunger were 4.02 times likely to be wasted in the last three months and were almost six times more likely to stunted at the same time. The likelihood of being underweight was 2.86 times more likely to occur in households with food insecurity without hunger and 4.89 times in food insecurity with hunger households. In the past 12 months, children from households with food insecurity with hunger were 8.56 times and four times more likely to be stunted with food insecurity without hunger. Underweight children had twice the odds of occurring in households with food insecurity without hunger compared with food secured households. HFS in the last three months had a significant association with wasting, stunting and underweight of the children, while HFS in the last 12 months was associated with stunting and underweight children.
Conclusion: Low HDD had resulted in stunting, and food insecurity had resulted in wasting, stunting and underweight in under-five Dayak children in rural areas of Sarawak. A food-based intervention programme should be undertaken for malnourished children.
Keywords: Stunting, Dietary diversity, Food security, Sarawak.
Introduction
Malnutrition technically means imbalanced nutrition, either under or overnutrition. As a developing country, Malaysia is concerned about undernutrition. On the other hand, changes in eating behaviours in industrialised countries lead to increased overnutrition. The prevalence of malnutrition in Malaysia is still significantly high, although the rates gradually decrease over the past decades. The National Health and Morbidity Survey (NHMS) 2016 reported that the prevalence of stunting, underweight, and wasting among Malaysians under five years children were 20.7%, 13.7%, and 11.2%, respectively.1
Dietary diversity has been a popular method to assess food variation and nutritional adequacy of an individual or household levels. A high level of dietary diversity is considered to indicate an adequate intake of essential nutrients, promote good health and better nutritional status.2,3 Household Dietary Diversity (HDD) consists of 12 groups of foods measured at household level.4,5 The measurement scores of HDD would categorize households as low HDDs of £3; medium HDDs of 4-6; and high HDDs of 7–12. Scoring of HDDs £3 is considered low dietary diversity while consuming four food groups over 24 hours is considered good dietary diversity.6 Multiple studies revealed that HDD is strongly associated with childhood growth indicators.7–11
Household food security is another important indicator to measure well-being by identifying the food-insecure, assessing the severity of food inadequacy and characterising the nature of the insecurity.12 Poverty is one of the main risk factors for food insecurity whereby households were prone to have poor quality and quantity of food intake.13 Food security is related to better nutrient intakes, proper eating behaviours and good nutritional status among the household members.14 Rao et al and WHO had identified that children at the ages of 6 months to 59 months are the critical period for milestones development.15,16 Thus, this age group represent the window periods of malnutrition if nutritional needs are not taken well. Children need more energy and adequate nutrients to grow and develop. In relation to children’s nutritional status, the risk of malnutrition would be reduced by 12 % among children from food secured households.17
Dayak communities are the ethnic majority residing in the rural areas of Sarawak, Malaysia. Despite them being the majority of rural dwellers, the nutritional status of their children was poorly known. Therefore, this study aimed to determine the relationship between under-five nutritional status and dietary diversity and food security among the Dayak communities in the rural areas of Sarawak, Malaysia.
Materials and Methods
Study setting and sampling
This was a cross-sectional community-based study conducted in Sarawak, Malaysia. Five divisions were randomly selected from the total of 14 divisions in the state of Sarawak. From each selected division, two districts were randomly selected. Then, five villages of Dayak communities were selected from each district, resulting in the involvement of 50 villages and 808 households, which were selected through systematic random sampling. The sample size was calculated with the base population proportion of children with malnutrition of 20.9% 18 with 1.96 stan•dard values for two-tailed tests and 5% absolute precision.18 The sample size was further inflated, multiplying by design effect 2 and 15% non-response rate. The average family size in Sarawak was 4.3, and the anticipated proportion of under-five children was 4%, yielding the sample size of 590 households.19
Study population
The participants consisted of parents aged 18 years and above with under-five children or children in their households. Participants who were residents of the study area less than six months, parents or caretakers who were seriously ill and had difficulty communicating, and children with physical deformities that hindered height measurements at the time of data collection were excluded from the study.
Data collection instrument
A structured questionnaire relating to household dietary diversity and household food security was used to collect data from the respondents. The questionnaire was adopted and adapted from various questionnaires based on the study’s objectives. Each structured questionnaire consists of four sections: Sociodemographic characteristic of the parents where the variables included the age, level of education, types of occupation, size of family and monthly household income. The second part was the household’s dietary diversity, which required respondents to recall the types of food consumed in the past 24 hours. Respondents would answer either “Yes” or “No” only. The questions were adopted from the Food and Agriculture Organization (FAO) of the United Nations to precisely measure the Household Dietary Diversity Score (HDDS).5 Household food security was the third part of the questionnaire. This construct was intended to assess the household food security in the past three months and 12 months’ period. For the household food consumption in the past three months, there were 11 questions about food security patterns, while eight questions were related to the household food consumption patterns in the past 12 months. For the questions on food security in the past three months, each question would be answered based on the Likert scale from “Never” to “Always”. As for the questions on food security in the past 12 months, each of the questions would be responded to as either “No”, “Yes”, “Do not know” or “Not applicable”. The constructs were adopted from Food and Nutrition Technical Assistance (FANTA III), where the researchers were able to measure the household food security based on the Household Food Insecurity Access Scale (HFIAS).20
The last part of the questionnaire was the children characteristic and their anthropometric measurements. Data on age and gender were collected. The measurement included the body weight (kg) and height (cm) based on FAO.21 Children were measured for standing height without shoes using a SECA portable body meter (SECA 206, Germany) to the nearest 0.1 cm except for children with 6–23 months of age among who recumbent lengths were measured. The body weight of infants and young children was measured using a digital weighing scale (Tanita 1583, Japan) to the nearest 0.01 kg. Children who were able to stand upright were weighed using a digital lithium weighing scale (Tanita 318, Japan) to the nearest 0.1 kg.
A pilot test was conducted among 30 respondents from a similar population not included in the main study. The questionnaire was modified based on the pre-test results, where domain-wise Cron•bach’s alpha was calculated, and it varied from 0.688 to 0.890. A one-day intensive training was given to the selected research assistants by the investigator. The training included the study objectives, review of questionnaires, techniques of anthropometric measurements and ethics during fieldwork. There was a close su•pervision of the interviewers during data collection. Measurement was taken using UNICEF’s standard instruments of weighing scale and portable body meter height and was routinely checked and adjusted to maintain its accuracy. Calibration of the indicator against zero reading was checked following the weighing of every child.
Participation in this study was entirely voluntary. Respondents were briefed about the confidentiality of the information given. Informed written consent was obtained from the participants. No financial or any other incentives were provided for their participation. The study received ethical approval from the Ethics Committee of the Faculty of Medicine and Health Science, Universiti Malaysia Sarawak (UNIMAS) (UNIMAS/NC-21.02/03-02 Jld.3 (80)) and the Medical Research and Ethics Committee (MREC), Ministry of Health Malaysia (KKM/NIHSEC/P19-877 (6)).
Under-five Nutritional status: The measurements were recorded into the software WHO Anthro version 3.2.2, which was readily downloaded from the WHO website.22 WHO Anthro 3.2.2 software was used to convert weight, height, and age of the child (months) into height-for-age (HAZ), weight-for-age (WAZ), and weight-for-height (WHZ) z-scores to assess malnutrition considering gender. Anthropometric classifications were based on global standards. Children with HAZ, WAZ, and WHZ below “2 SD of the median of reference population were considered stunted, underweight, and wasted, respectively.23 The assessment of the growth development in the study was based on the Malaysian children growth centile charts recommended by WHO Global Database on Child Growth and Malnutrition.24,25
Household dietary diversity (HDD) score: The types of food consumed by the households in 24 hours.5 The full HDD score for each household was 12. According to FAO,4 low HDDs of ≤3; medium HDDs of 4-6; and high HDDs of 7-12.
Household food security score: For calculation of food security in the last 3 months, the response ‘never’ and ‘rarely’ was scored as ‘0’ each, while ‘sometimes’, ‘very often’ and ‘always’ were scored as ‘1’ each. The summative score was further classified into three groups based on percentile. The score was further classified as food secure, food insecure without hunger, and severe food insecurity with hunger. The lowest percentile, i.e., scores ‘0’, was considered food secured. The second percentile was considered as food insecurity without hunger, and the last percentile was food insecurity with hunger. For food security in the last 12 months, all the items of the question with the positive response were counted and summed up. Based on summative counts, the lowest counts (<2) were classified as no food insecurity (i.e., food secured), the counts 2 to 4 were considered food insecurity without hunger and the rest score was considered food insecurity with hunger.
Data coding and verification of response was made on the same day immediately after the interview. The complete data was entered into Microsoft Office Excel 2010 with a validation check. From Microsoft Excel, the data was exported to Statistical Package for Social Science (SPSS) version 22.0.26 It was checked again for any inconsistencies, missing values and duplication. The output of the analysis was presented in the form of mean, median, minimum and maximum values and standard deviation for continuous data while percentages for categorical data. All continuous variables were then transformed into categorical data for further analysis. The multivariate regression analysis was used to relate the nutritional status of children and dietary diversity, and food security. The strength of association was measured by a 95% confidence interval (adjusted odds ratio). All models were checked for the goodness of fit using the Hosmer and Lemeshow fit test. A p-value of £0.05 was considered significant statistically.
Several limitations of the study were worth to be mentioned and for consideration in future studies. Firstly, the study was based on cross-sectional data that were collected for one year. To understand further the relationship between the nutritional status of children with household dietary diversity and food security, data collection needs to be conducted alternately in that particular year. Seasonality might affect the activities of the rural dwellers. Hence, it could also influence the households’ food security, especially when the data collection was conducted during the harvesting season. The households might not encounter food insecurity due to the availability of food resources. Paddy harvesting season is usually from March to May annually. Secondly, recall bias was one of the limitations during the data collection, especially when respondents needed to recall the types of food consumed within the 24 hours to determine dietary diversity. The capability to recall the event may be worst for those caregivers who did not participate in food preparation at home. There were times that they recalled the types of food which had been consumed on the other days. Similarly, the food security questions would require the households to recall their experience in the past 12 months. The time frame was too broad, and the information given by the respondents might not be accurate. Thirdly, the food diversity did not assess the amount of food consumption. Some households had low dietary diversity, but more portions were taken especially carbohydrate-based food. Despite all the limitations, the results of this study will provide important contributions to the limited data available on household food insecurity and the nutritional status of children in the study area.
Results
The mean age for fathers was 35.37 (8.28) years old and 32.42 (7.63) years old for mothers. Fathers’ levels of education were mainly until secondary school and above (78.3%), similarly, mothers at 73.1%. The majority of the fathers were employed (64.5%), while 69.7% of the mothers were unemployed or being housewives. The median family size was six, with a minimum of three-person and a maximum of 14 persons in the household. The average monthly income stood at MYR 1532.08 (1362), with half of the households earned MYR 1200 and below.
| Characteristics | Number | Percentage | Statistics |
|---|---|---|---|
| Age in years (Fathers) | |||
| < 35 | 420 | 52.0 | Mean (SD)= 35.37 (8.28)yrs |
| ≥35 | 388 | 48.0 | Min = 21 yrs: Max = 63 yrs |
| Age in years (Mothers) | |||
| <30 | 320 | 39.6 | Mean (SD)= 32.42 (7.63)yrs |
| ≥30 | 488 | 60.4 | Min = 20 yrs: Max = 60 yrs |
| Level of education (Fathers) | |||
| Primary and below | 175 | 21.7 | |
| Secondary and above | 633 | 78.3 | |
| Level of education (Mothers) | |||
| Primary and below | 217 | 26.9 | |
| Secondary and above | 591 | 73.1 | |
| Employment status (Fathers) | |||
| Unemployed | 287 | 35.5 | |
| Employed | 521 | 64.5 | |
| Employment status (Mothers) | |||
| Unemployed | 563 | 69.7 | |
| Employed | 245 | 30.3 | |
| Family size | |||
| ≤5 | 388 | 48.0 | Median = 6; Min = 3; Max = 14 |
| > 5 | 420 | 52.0 | |
| Monthly income (MYR) | |||
| < 1200 | 408 | 50.5 | Mean (SD) = MYR 1532.08 (1362) |
| ≥1200 | 400 | 49.5 | Min = MYR 150; Max = MYR 7500 |
A total of 808 under-five children’s data were analysed. The mean (SD) age was 30.35 (16.16) months, and gender-wise was equally balanced between male and female. The percentage of wasted children was 6.7%, overweight and obese were at 5.3%, stunted at 18.1%, and underweight was at 14.3%. The normal nutritional status of the children dominated all the indicators, with not less than 80% of the total children in each indicator (table II).
| Characteristics | Number | Percentage | Statistics |
|---|---|---|---|
| Age in months | |||
| < 11 | 107 | 13.2 | |
| 11-23 | 204 | 25.2 | Mean (SD) = 30.35 (16.16) months |
| 24-35 | 169 | 20.9 | Median = 29 months |
| 36-47 | 144 | 17.8 | Min = 6 months; Max = 59 months |
| 48-59 | 184 | 22.8 | |
| Gender | |||
| Male | 413 | 51.1 | |
| Female | 395 | 48.9 | |
| Weight for height (WHZ) | |||
| Severely wasted (d”-3 SD) | 9 | 1.1 | |
| Wasted(≤-2 SD) | 45 | 5.6 | |
| Normal (> - 2 SD to <2 SD) | 711 | 88.0 | |
| Overweight (≥2 SD) | 33 | 4.1 | |
| Obese (≥3 SD) | 10 | 1.2 | |
| Height for age (HAZ) | |||
| Severely stunted (≤-3 SD) | 23 | 2.8 | |
| Stunted (≤-2 SD) | 124 | 15.3 | |
| Normal (> - 2 SD to < 2 SD) | 661 | 81.8 | |
| Weight for age (WAZ) | |||
| Severely underweight (≤-3 SD) | 3 | 0.4 | |
| Underweight (≤-2 SD) | 112 | 13.9 | |
| Normal (>-2 SD to < 2 SD) | 693 | 85.8 | |
Household Dietary Diversity (HDD): All the households consumed rice. Rice was in the form of porridge, bread, noodles and other carbohydrate sources. It was also a staple food in the community. Vegetables and spices, condiments and beverages were highly consumed at 97.2% and 95.3% of the households. The least food consumed were legumes, nuts and seeds (14.7%) and white roots and tubers at 11.3% (table III).
| Types of food | n | % |
|---|---|---|
| Rice | 808 | 100.0 |
| Vegetables | 785 | 97.2 |
| Spices, condiments and beverages | 770 | 95.3 |
| Oils and fats | 664 | 82.2 |
| Meat, poultry and offal | 660 | 81.7 |
| Sugar and honey | 657 | 81.3 |
| Eggs | 470 | 58.2 |
| Fish and seafood | 469 | 58.0 |
| Milk and milk products | 218 | 27.0 |
| Fruits | 172 | 21.3 |
| Legumes, nuts and seeds | 119 | 14.7 |
| White roots and Tubers | 91 | 11.3 |
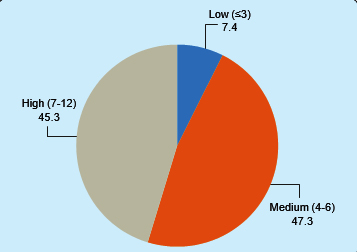
The Household Dietary Diversity (HDD) score revealed a high HDD accounting 45.3%, and 47.3% had 4 to 6 HDD or medium scores, which was the highest percentage. The low HDD score was 7.4% (Figure 1). For food security in last 3 months, the lowest percentile, ie, scores ‘0’, was considered food secured (72.5%). The second percentile was considered as food insecurity without hunger (13.4%), and the last percentile was food insecurity with hunger (14.1%). For food security in the last 12 months, the lowest counts (<2) were classified as no food insecurity (i.e., food secured), which amounts to 71.5%. The counts 2 to 4 were considered food insecurity without hunger, which constituted 18.9%, and the rest score was considered food insecurity with hunger (9.5%) (table IV).
| Level of food security | Last 3 months | Last 12 months | ||
|---|---|---|---|---|
| Number | Percentage | Number | Percentage | |
| Food secured | 586 | 72.5 | 578 | 71.5 |
| Food insecurity without hunger | 108 | 13.4 | 153 | 18.9 |
| Food insecurity with hunger | 114 | 14.1 | 77 | 9.5 |
Relationship between dietary diversity, food security and nutritional status: Multivariate binary logistic regression analysis
A multivariate binary logistic regression analysis was done to determine the independent effect of dietary diversity and food security on the nutritional status.27,28 Analysis of the nutritional status of children by HDD scores showed households with low HDD had almost two times (AOR = 1.683, 95% CI: 0.424, 2.036) the odds of having children who were stunted compared to households with high HDD. For food security in the past three months, children from households with food insecurity without hunger and with hunger were four times odds of having children who were wasted and about three to five times the odds of having children who were underweight. On the other hand, children from households with food insecurity with hunger households had almost six times the odds of being stunted compared to children from households that were food secure. Analyses of food security in the past 12-months showed that children from households with food insecurity without and with hunger had four to nine times the odds of being stunted and twice the odds of being underweight compared to children from households with food insecurity without hunger and children from households with no food insecurity respectively (table V).
Independent variables |
Wasted (n=54) |
Stunted (n=147) |
Underweight (n=115) |
||||||
|---|---|---|---|---|---|---|---|---|---|
AOR |
LL |
UL |
AOR |
LL |
UL |
AOR |
LL |
UL |
|
Dietary diversity score |
|||||||||
Low |
2.030 |
0.751 |
5.486 |
1.683* |
0.424 |
2.036 |
1.062 |
0.395 |
2.856 |
Medium |
1.056 |
0.516 |
2.162 |
1.029 |
1.035 |
2.737 |
1.033 |
0.550 |
1.943 |
High (RC) |
1.000 |
|
|
1.000 |
|
|
1.000 |
|
|
Food security (3 months) |
|||||||||
No food Insecurity (RC) |
1.000 |
|
|
1.000 |
|
|
1.000 |
|
|
Food insecurity without hunger |
3.861** |
1.432 |
3.967 |
1.618 |
0.898 |
2.917 |
2.861** |
1.770 |
3.251 |
Food insecurity with hunger |
4.025** |
1.205 |
5.065 |
5.614** |
3.173 |
9.932 |
4.882** |
1.563 |
5.312 |
Food security (12 months) |
|||||||||
No food Insecurity (RC) |
1.000 |
|
|
1.000 |
|
|
1.000 |
|
|
Food insecurity without hunger |
0.117 |
0.069 |
0.199 |
4.055** |
2.047 |
8.032 |
2.020* |
0.902 |
4.522 |
Food insecurity with hunger |
0.247 |
0.124 |
0.489 |
8.551** |
5.025 |
14.551 |
2.490 |
1.230 |
5.041 |
Classification |
|
93.3% |
|
|
84.2% |
|
|
91.7% |
|
Hosmer Lemeshow |
|
0.872 |
|
|
0.037 |
|
|
0.484 |
|
LR Chi-Square |
126.351; df (6), p<0.001 |
209.033; df (6), p<0.001 |
333.981; df (6), p<0.001 |
||||||
Cox and Snell R2 |
|
0.145 |
|
|
0.228 |
|
|
0.339 |
|
Nagelkerke R2 |
|
0.373 |
|
|
0.372 |
|
|
0.606 |
|
RC |
Reference category |
|
|
||||||
p-value |
*p<0.05, **p<0.01, ***p<0.001 |
|
|
||||||
LL |
Lower limit of 95% confidence interval |
|
|
||||||
UL |
Upper limit of 95% confidence interval |
|
|
||||||
Discussion
The prevalence of wasting, stunting and underweight among the under-five Dayak children in the rural areas of Sarawak were 6.7%, 18.1% and 14.3%, respectively. These prevalence indicators were still lower compared to the estimates published by the WHO , among the low middle-income countries and most of the African countries.7,16,29 The Malaysian national prevalence of wasting, stunting, and underweight was 11.5%, 20.7%, and 13.7% respectively.1 The underweight prevalence in the present study was noted to be higher. This could be explained by the margin of difference between rural and urban areas as more overweight, and obese children were reported in the urban settings than children in the rural.30,31 In Kelantan, Malaysia, with almost similar rural area settings, Lian et al. reported a high prevalence of stunting, underweight, wasting at 69%, 63.4% and 40% respectively.32
Children in households with low HDD were likely to be stunted. A similar finding was reported by Ogechi & Chilezie among the children in the rural areas of Nigeria.33 In Bangladesh, Rah et al. reported that low dietary diversity was a predictor of children with stunting in the households.34 Consumption of a highly diverse diet is beneficial, and it significantly reduces the prevalence of malnutrition overall among children.9 In the present study, dietary diversity was not associated with wasting and underweight of the children as most households had at least medium to high HDD scores. Households also had access to their food crops as a high percentage of the respondents were farmers.
The present study indicated that food security in the past three months was associated with the prevalence of undernutrition among the children. A similar finding was reported by Ihab et al. among the low-income rural dwellers in north-eastern Peninsular Malaysia.35 In that study, children in food-insecure households were three times more likely to be stunted and 2.15 times more likely to be underweight than children in food-secure households. Another study in Nigeria reported a high likelihood of wasted and underweight children in food-insecure households. They had a history of reducing their meal portions due to financial constraints.36 Other factors that influenced wasting among children were poverty, less educated parents and recent illnesses among children.37
Assessment of household food security in the last 12 months revealed that it had a significant association with the prevalence of stunting and underweight but not with wasting. These findings were in accordance with Betebo, who stated that wasting among the children was not significantly related to household food security as food insecurity was not acute.38 In similar rural settings, the nutritional status of children was not only influenced by food security but also the age of the children, birth weight and duration of breastfeeding.39 In other perspectives, the importance of food security was not limited to markets’ supply and demand dynamics. However, it was also related to the utilization of food products such as safe preparation, protection, and control of foods from pest infestations to healthy and nutritious consumption of foods. In some rural areas, improper sanitation and untreated water sources lead to unsafe food consumption that resulted in infection and diseases to the children, thus, affecting their nutritional status, growth and development.40
Many studies reported that household food security was not fully associated with the nutritional status of the children but influenced by other multiple factors such as maternal weight, household wealth, children’s health conditions, breastfeeding duration and household size.41-43,13,35
Conclusion
The prevalence of wasting, stunting and underweight among the under-five Dayak children in the rural areas of Sarawak was 6.7%, 18.1% and 14.3% respectively. Low HDD was predominantly associated with the prevalence of stunting in children. In the last three months, food security was significantly associated with undernutrition, while food security in the last 12 months was associated with stunting and underweight. Further research needs to explore other multiple predictors such as maternal and child factors, medical history, socio-economic and environmental conditions to support these findings. A food-based intervention program should be undertaken for malnourished children, especially among the household with insecure food.
Acknowledgments
We are grateful to the Ketua Kampung (village headmen) for their support in selecting the houses and identification of respondents through the development of a sampling frame. We are also grateful to the research assistants who were involved in data collection. Furthermore, our gratitude goes to all the respondents who participated in this study. Our gratitude to Yayasan Dayak Chair, Institute of Borneo status, Universiti Malaysia Sarawak (ref: F05/DRC/1810/2019) for a grant that enables us to complete these tasks.
References
- IPH, Malaysia. National Health and Morbidity Survey 2016 (NHMS 2016): Maternal and Child Health. Vol. I: Methodology and General Findings, 2016. Institute for Public Health (IPH), Ministry of Health Malaysia; 2016:120.
Url: iku.moh.gov.my/images/IKU/Document/REPORT/2016/NHMS2016ReportVolumeI.pdf - Ruel MT. Operationalizing Dietary Diversity: A Review of Measurement Issues and Research Priorities. J Nutr. 2003;133:3911S-3926S.
Doi:10.1093/jn/133.11.3911S - WHO WHO. PAHO/WHO Guiding principles for Complementary Feeding of the Breastfed Child. Published online 2001. Accessed November 1, 2020.
Url:www.ennonline.net/compfeedingprinciples - FAO. Dietary Diversity. Published 2020. Accessed November 1, 2020.
Doi:inddex.nutrition.tufts.edu/data4diets/data-source/dietary-diversity - Kennedy G, Ballard T, Dop M-C. Guidelines for Measuring Household and Individual Dietary Diversity. FAO; 2011.
Doi: - FAO. An Introduction to the Basic Concepts of Food Security. Published 2008. Accessed November 26, 2020.
Url:www.fao.org/documents/card/en/c/2357d07c-b359-55d8-930a-13060cedd3e3/ - Dukhi N. Global Prevalence of Malnutrition: Evidence from Literature. Malnutrition. Published online April 5, 2020.
Doi:10.5772/intechopen.92006 - Kassie GW, Workie DL. Determinants of under-nutrition among children under five years of age in Ethiopia. BMC Public Health. 2020;20:399.
Doi:10.1186/s12889-020-08539-2 - Khamis AG, Mwanri AW, Ntwenya JE, Kreppel K. The influence of dietary diversity on the nutritional status of children between 6 and 23 months of age in Tanzania. BMC Pediatr. 2019;19:518.
Doi:10.1186/s12887-019-1897-5 - Nepali S, Simkhada P, Davies IG. Association between wasting and food insecurity among children under five years: findings from Nepal demographic health survey 2016. BMC Public Health. 2020;20:1027.
Doi:10.1186/s12889-020-09146-x - Tad AC, M SS, Pa H. Nutritional status and dietary intake of semai indigenous children below five years in perak, peninsular malaysia. Malays J Public Health Med. 2019;19:84-100.
Doi:10.37268/mjphm/vol.19/no.1/art.40 - Hoddinott J, Yohannes Y. Dietary Diversity as a Food Security Indicator. Ood Consum Nutr Div Int Food Policy Res Inst. Published online 2002:2.
- Mohamadpour M, Sharif ZM, Keysami MA. Food Insecurity, Health and Nutritional Status among Sample of Palm- plantation Households in Malaysia. J Health Popul Nutr. 2012;30:291-302. Accessed November 1, 2020
Available From:PMC3489945 - Parker ED, Widome R, Nettleton JA, Pereira MA. Food security and metabolic syndrome in U.S. adults and adolescents: findings from the National Health and Nutrition Examination Survey, 1999-2006. Ann Epidemiol. 2010;20:364-370.
Doi:10.1016/j.annepidem.2010.02.009 - Rao S, Swathi P, Unnikrishnan B, Hegde A. Study of complementary feeding practices among mothers of children aged six months to two years - A study from coastal south India. Australas Med J. 2011;4:252-257.
Doi:10.4066/AMJ.2011.607 - WHO. Joint child malnutrition estimates. The Global Health Observatory. Published 2021. Accessed February 1, 2021.
Available From:www.who.int/data/maternal-newborn-child-adolescent/gama/activities-of-gama - Mutisya M, Kandala N, Ngware MW, Kabiru CW. Household food (in)security and nutritional status of urban poor children aged 6 to 23 months in Kenya. BMC Public Health. 2015;15:1052.
Doi:10.1186/s12889-015-2403-0 - Eunice MJ, Cheah WL, Lee PY. Factors Influencing Malnutrition among Young Children in a Rural Community of Sarawak. Mal J Nutr. 2014;20:145-164. Accessed October 30, 2020.
Available From:ir.unimas.my/id/eprint/5204/ - DOSM. Department of Statistics Malaysia Official Portal. Published 2020. Accessed March 21, 2021.
Available From:www.dosm.gov.my/v1/index.php?r= column/cone&menu_id=clJnWTlTbWFHdm UwbmtSTE1 EQStFZz09 - Coates J, Swindale A, Bilinsky P. Household Food Insecurity Access Scale (HFIAS) for Measurement of Food Access: Indicator Guide: Version 3: (576842013-001). Published online 2007.
Doi:10.1037/e576842013-001 - FAO, ed. Building Resilience for Food and Food Security. FAO; 2017.
- WHO. WHO Anthro (version 3.2.2, January 2011) and macros. Child growth standards. Published 2011. Accessed December 4, 2018.
Available From:www.who.int/childgrowth/software/en/ - Frison S, Kerac M, Checchi F, Prudhon C. Anthropometric indices and measures to assess change in the nutritional status of a population: a systematic literature review. BMC Nutr. 2016;2:76.
Doi:10.1186/s40795-016-0104-4 - Bong Y, Shariff AA, Mohamed AM, Merican AF. Malaysian growth centiles for children under six years old. Ann Hum Biol. 2015;42:109-116.
Doi:10.3109/03014460.2014.912679 - De Onis M, Blössner M. Nutrition WHOP of WHO Global Database on Child Growth and Malnutrition. Geneva/ : World Health Organization; 1997. Accessed December 9, 2018.
Available From: apps.who.int/iris/handle/10665/63750 - IBM SPSS. IBM SPSS Statistics for Windows. IBM SPSS; 2013.
- Pallant J. SPSS Survival Manual: A Step-by-Step Data Analysis Using SPSS. 6th Edition. Open University Press; 2016. Accessed July 30, 2018.
Available From:www.amazon.com/SPSS-Survival-Manual-Julie-Pallant/dp/033526154X/ref=la_B001IQZKQ4_1_1?s=books&ie=UTF8&qid=1532881998&sr=1-1 - Tabachnick BG, Fidell LS. Using Multivariate Statistics. 7th Edition. Pearson Education, Inc; 2019.
- Li Z, Kim R, Vollmer S, Subramanian SV. Factors Associated With Child Stunting, Wasting, and Underweight in 35 Low- and Middle-Income Countries. JAMA Netw Open. 2020;3(4):e203386.
Doi:10.1001/jamanetworkopen.2020.3386 - Agbozo F, Atito P, Abubakari A. Malnutrition and associated factors in children: a comparative study between public and private schools in Hohoe Municipality, Ghana. BMC Nutr. 2016;2:32.
Doi:10.1186/s40795-016-0073-7 - Nouri Saeidlou S, Babaei F, Ayremlou P. Malnutrition, Overweight, and Obesity among Urban and Rural Children in North of West Azerbijan, Iran. Journal of Obesity.
Doi:10.1155/2014/541213 - Lian CW, Wan Muda WAM, Mohd Hussin ZA, Ching Thon C. Factors Associated With Undernutrition Among Children in a Rural District of Kelantan, Malaysia. Asia Pac J Public Health. 2012;24:330-342.
Doi:10.1177/1010539510380737 - Ogechi UP, Chilezie OV. Assessment of Dietary Diversity Score, Nutritional Status and Socio-demographic Characteristics of Under-5 Children in Some Rural Areas of Imo State, Nigeria. Published online 2017:11.
- Rah JH, Akhter N, Semba RD, et al. “Low Dietary Diversity Is a Predictor of Child Stunting in Rural Bangladesh. Eur J Clin Nutr. 2010;64:1393-1398.
Doi:10.1038/ejcn.2010.171 - Ihab AN, Rohana AJ, Manan WMW, Suriati WNW, Zalilah MS, Rusli AM. Nutritional Outcomes Related to Household Food Insecurity among Mothers in Rural Malaysia. J Health Popul Nutr. 2013;31:480-489. Accessed February 14, 2021.
PMC:PMC3905642 - Ajao K, Ojofeitimi E, Adebayo A, Fatusi A, Afolabi O. Influence of Family Size, Household Food Security Status, and Child Care Practices on the Nutritional Status of Under-five Children in Ile-Ife, Nigeria. Published online 2010:10.
- Belayneh M, Loha E, Lindtjorn B. Food Insecurity, Wasting and Stunting Among Young Children in a Drought Prone Area in South Ethiopia: A Cohort Study (P04-040-19). Curr Dev Nutr. 2019;3(nzz051.P04-040-19).
Doi:10.1093/cdn/nzz051.P04-040-19 - Betebo B, Ejajo T, Alemseged F, Massa D. Household Food Insecurity and Its Association with Nutritional Status of Children 6–59 Months of Age in East Badawacho District, South Ethiopia. J Environ Public Health. 2017;2017.
Doi:10.1155/2017/6373595 - Whye Lian C, Wan Muda WAM, Mohd Hussin ZA, Ching Thon C. Factors Associated With Undernutrition Among Children in a Rural District of Kelantan, Malaysia. Asia Pac J Public Health. 2012;24:330-342.
Doi:10.1177/1010539510380737 - Myers SS, Smith MR, Guth S, et al. Climate Change and Global Food Systems: Potential Impacts on Food Security and Undernutrition. Annu Rev Public Health. 2017;38: 259-277.
Doi:10.1146/annurev-publhealth-031816-044356 - Chakona G, Shackleton CM. Household Food Insecurity along an Agro-Ecological Gradient Influences Children’s Nutritional Status in South Africa. Front Nutr. 2018;4.
Doi:10.3389/fnut.2017.00072 - Osei A, Pandey P, Spiro D, et al. Household Food Insecurity and Nutritional Status of Children Aged 6 to 23 Months in Kailali District of Nepal. Food Nutr Bull. 2010;31:483-494.
Doi:10.1177/156482651003100402 - Mulu E, Mengistie B. Household food insecurity and its association with nutritional status of under five children in Sekela District, Western Ethiopia: a comparative cross- sectional study. BMC Nutr. 2017;3:35.
Doi:10.1186/s40795-017-0149-z
Department of Community Medicine and Public Health, Universiti Malaysia Sarawak, Malaysia.
rmmizanur@unimas.my
 0000-0002-0706-2920
Submission
2020-09-07
Accepted
2021-06-30
Published
2021-08-01
Apply citation style format of Bangladesh Medical Research Council
Issue
Vol 47 No 2 (2021)
Section
Research Articles
Financial Support
Yayasan Dayak Chair, Institute of Borneo status, Universiti Malaysia Sarawak (ref:F05/DRC/1810/2019)
Conflict of Interest
The authors declare no potential conflicts of interest.