Ferdous Hakim
Mental and Neurology Study Team, National Institute of Mental Health, Sher-E-Bangla Nagar, Dhaka, Bangladesh.
Rijwan Bhuiyan
Mental and Neurology Study Team, National Institute of Mental Health, Sher-E-Bangla Nagar, Dhaka, Bangladesh.
Mst. Khaleda Akter
Mental and Neurology Study Team, National Institute of Mental Health, Sher-E-Bangla Nagar, Dhaka, Bangladesh.
Md. Abdul Mohit
National Institute of Mental Health, Sher-E-Bangla Nagar, Dhaka, Bangladesh.
Md. Faruq Alam
National Institute of Mental Health, Sher-E-Bangla Nagar, Dhaka, Bangladesh.
Md. Rizwanul Karim
Mental Health and Disability Programme, Directorate General of Health Services, Dhaka, Bangladesh.
M Mostafa Zaman
Research and Publication Unit, World Health Organization, Dhaka, Bangladesh.
Keywords: Weighting, Base weight, Population calibration, Trimming
DOI: 10.3329/bmrcb.v47i2.57769
Abstract
Background: Weighting of national survey data enables the sample to be more representative of the target population. Weighting procedure is a thorough exercise and yields several types of weights. However, considerable variation exists among authors on which weight to use leaving the researchers baffled. As a result, survey data are often used by researchers without the weights leading to erroneous conclusions. In addition, despite availability of powerful yet costly statistical software-- researchers from developing countries are mostly unable to use those due to high cost. In this article, we share our experience on weighting for recent national surveys in Bangladesh using Microsoft Excel.
Objective: Overall objective was to perform sample weighting of a national survey of Bangladesh using Excel. As specific objective, the study was aimed at creating different weighting variables, describe their features and identify the appropriate weight to be used for analysis.
Methods: We generated four types of weights: the base weight calculated from probabilities of selection, and non-response adjusted, population calibration adjusted, and trimmed weights. We compared the distribution of the population by sex and age by unweighted and four types of weighted numbers. Finally, we calculated weighted means, medians, ranges, standard errors, confidence intervals, variances, multiplicative effects and design effects with these four weights. In addition, we compared the weighted prevalence of a key variable of the survey using these four weights.
Results: We compared unweighted distribution with weighted ones and identified that weighting makes the sample distribution to conform to the target population. Among the four calculated weights, the trimmed weight had narrow standard error and variance, and smallest design and multiplicative effects. It yielded an acceptable prevalence and distribution of prevalence of mental disorder.
Conclusion: Among the four weights, we show that the trimmed weight met all parameters of good quality and precision. We performed this complex exercise using Microsoft Excel which is largely available to researchers in Bangladesh. Therefore, we recommend using the trimmed weight for national level surveys in Bangladesh in a similar context.
Keywords: Weighting, Base weight, Population calibration, Trimming.
Introduction
Sample survey is one of the most important methods of collecting health data that can draw conclusion on a reference population.1 However, accurate inference cannot be drawn without treating the sample data.2 Weighting corrects the imperfections in the sample that prevents bias and other differences between the sample and the reference population.3 In complex sample surveys four types of imperfections emerge from unequal probabilities of selections, multistage selection, stratifying sample into the reporting domains, and non-responses.4 Ignoring these will lead to incorrect inferences in a survey.
Though sample survey can draw conclusion to a reference population, the results may be influenced by sampling and non-sampling errors.1,5 Among the non-sampling errors, non-response – both unit non- response and item non-response – is addressed rigorously through weighting.6 Adjustment of the non- sampling error can be different depending on the data collection technique of the survey - digital and paper-pencil.7 Digital data collection has a well-ordered method to adjust non-sampling error compared to pen- paper based one.8 Several recent national level household (HH) surveys in Bangladesh used digital data collection tools.9-11
In addition, weighting adjusts the weighted sample distribution for key variables of interest (for example, age, race, and sex) to make it conform to a known population distribution.3 Production of design-unbiased estimates of parameters of interest is possible by applying proper weights.12 Thus weighting procedure is a critical step after the survey data have been collected and all the essential steps of data processing have been completed.13 However, there is no universally held protocol for calculating weights. The aim of the weighting procedure is to calculate the ‘final weight’ starting with base weight, and non-response, population calibration and trimming adjustments.
Testing variability of the calculated non-response rates and weight is an important step of generating acceptable weights.9 High variation in weights can lead to some observations having too much importance leading to distortion of results.14 In addition, if the sampling design is not informative, using the weights should not introduce any significant differences in the estimates.12 In addition, if the sampling design turns out to be informative, the use of weighted estimators will produce “better” results.12 Additionally, a trimming procedure can be applied and the process varies between researchers.15,16
Weighting itself to some researchers is like a black box.13 Handling different types of weights and which to use sometimes lead researchers confused. In addition, although there are many powerful statistical softwares available for complex sample analysis, yet these are used much less in the financial context of a developing country like Bangladesh. As a result survey data are often used by researchers without the weights leading to erroneous conclusions.12 Given the influence weights have on survey results, it is important that researchers understand enough about weighting process to be discerning users of the survey data.13 In this article we briefly described the weighting process, our approach in identifying which weight to use and explain the reason behind selecting one. So far, there is no scientific article on weighting of national level survey data by researchers from Bangladesh and this article is the first of its kind in the context of performing the exercise using Microsoft Excel.
Materials and Methods
Brief overview of the weighting procedure: A detailed step-by-step procedure of weighting is described elsewhere.17 Following is a brief description:
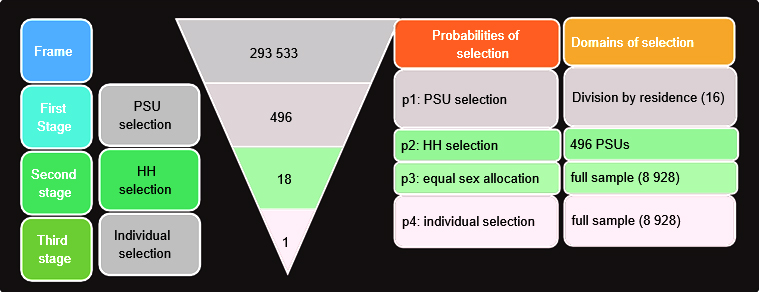
1. Base weight calculation: This involves the possibility of selection of PSUs (p1), HH (p2), sex randomization (p3) and individuals (p4) (figure 1).18
i. PSU selection probability (p1): Selection for PSUs within each of the 16 strata (8 division x 2 residence status) is done.
$$p1 = \frac{Number of selected PSUs in a strata (31)}{Total number of PSUs in that strata}$$ii. HH selection probability (p2): It is calculated by systematic selection of 18 HHs within each PSU. It is performed in 496 PSUs
$$p2 = \frac{Number of selected HHs in a PSU (18)}{Total number of HHs in that PSU}$$iii. Probability of sex randomization (p3): Equal HH sex allocation of the selected 18 HHs are undertaken in each PSU. This yielded a probability of ‘0.5’. This is applicable for all (8 928) the respondents of the survey.
$$p3 = \frac{Number of selected sexes (1)}{Total number of sex strata (2)}$$iv. Individual selection probability (p4): The selection probability for one eligible individual among a number/s of eligible HH members is calculated. This is obtained from the survey response data and is applicable to all the respondents of the survey.
$$p3 = \frac{Number of selected HH memebr (1)}{Total eligible HH members}$$The base weight is calculated as, $$base weight = \frac{1}{p1}\times\frac{1}{p2}\times\frac{1}{p3}\times\frac{1}{p4}$$
2. Non-response weight: In this step we estimated the probability of responses from ‘disposition codes’ (table I). The non-response weight factor is calculated by taking the inverse of the response rate for a subset of the survey and is undertaken at PSU, HH and individual levels.19
i. PSU-level non-response factor: This is applied for 16 strata (8 division x 2 residence status). It is calculated as,
$$PSU non-response factor = \frac{Sum of base weight of eligible PSUs}{Sum of base weight of completed PSUs}$$ii. HH non-response factor: It is calculated within each PSU, so there are 496 adjustment cells. The HH level non-response adjustment is calculated as,
$$HH non-response factor = \frac{Sum of base weight of eligible households}{Sum of base weight of completed households}$$i. Person non-response factor: It is calculated by gender, age group and a core variable of interest calculated in 16 (2x4x2) adjustment cells. The person-level non-response adjustment is,
$$Individual non-response factor = \frac{Sum of base weight of eligible households}{Sum of base weight of completed rosters}$$The non-response adjusted base weight is calculated by multiplying the three non-response factors with the base weights successively.
Non-response adjusted base weight
= base weight * non-reposnses weights (PSU x HH x Individual)
3. Population calibration: The goal was to bring weighted sums of the sample data in line with the corresponding age-sex matched counts of target population.20,21 Initially projected population is estimated (not described) – if recent population data unavailable – then population calibration factor (r) is calculated.
Calculating post stratification adjustment factor (r) The population calibration factor is calculated by division, residence, gender and the five age groups resulting in 160 (8 x 2 x 2 x 5) adjustment cells. The post-stratification adjustment is calculated as: Population calibrated weights are calculated by multiplying the non-response adjusted base weight with population calibration factor.
$$population calibration factor= \frac{projected population in a domain}{non response adjusted weights in that domain}$$4. Trimming of weight: We applied this procedure on the population calibrated weight.13 Initially we identified the extreme weights and fixed a cut-off value. The weights above the cut-off value were trimmed and equally distributed among the non- trimmed weights repeating this till no weights were above the cut-off point.15,16
We checked all the steps of calculations for the weighting process including the distribution of the weights specially taking notice of the extreme values and back-tracking these for possible errors.
Role of the funding source: No fund was required to undertake the exercise described in the manuscript.
Results
The results shown are extracted from the National Mental Health Survey (NMHS) Bangladesh 2019 where the estimated sample size of 8 928 – aged 18 years and above – was selected in three stages (Figure 1).11,22
The overall response rate of the survey was 90.4% (table I).24 We calculated the four weights using the mathematical formulas mentioned in the method section. We used Microsoft Excel (“Excel”) in Microsoft Office 365 bundle for this exercise.
1. ‘Base weight’ calculation: Probabilities of selection of PSUs, HHs, sex randomization and individual selection probability were taking into consideration. This is applied to 16 strata comprised of eight divisions and two residence strata. This procedure yielded a total base weight value of 79 422 102 (table II).
Status |
Number |
Percent |
|---|---|---|
A.Householdinterview |
|
|
Roster completed |
7320 |
91.1* |
Roster not completed |
719 |
8.9 |
Total |
8039 |
100.0 |
B.Individualinterview |
|
|
Completed |
7270 |
99.3† |
Not completed |
50 |
0.7 |
Total |
7320 |
100.0 |
Overall response rate |
- |
90.4‡ |
2. Non-response factor calculation:
i. PSU-level non-response factor: This is also calculated for 16 domains. The value for the PSU non-response is essentially ‘1’ for all the 15 domains except in the one domain where on PSU was dropped. The mean PSU non-response is 1.0008.
ii. HH non-response factor: This is calculated in all 496 PSUs. The mean PSU non- response is 1.1002.
iii. Person non-response factor: The mean PSU non-response is 1.1002.
When this base weight is adjusted with the non- response weights, the adjusted base weight stands at 92 569 866 (table II).
Sl. |
Strata code† |
Base weight‡ |
Non-response PSU§ HH§ |
factors Person |
Non-response |
Projected population¶ |
Population |
Population |
Trimmed weight‡‡ |
|
|---|---|---|---|---|---|---|---|---|---|---|
1 |
10212 |
4353.4 |
1.00 |
1.05 |
1.05 |
4808.0 |
416824.0 |
0.9155 |
4401.7 |
6472.1 |
2 |
10213 |
4353.4 |
1.00 |
1.05 |
1.05 |
4808.0 |
344170.0 |
0.9988 |
4802.1 |
6872.4 |
3 |
10211 |
13060.0 |
1.00 |
1.05 |
1.05 |
14424.0 |
558175.0 |
1.2017 |
17332.9 |
19403.2 |
~ |
~ |
~ |
~ |
~ |
~ |
~ |
~ |
~ |
~ |
~ |
~ |
~ |
~ |
~ |
~ |
~ |
~ |
~ |
~ |
~ |
~ |
8894 |
30114 |
17760.7 |
1.00 |
1.10 |
1.21 |
23636.9 |
558955.0 |
1.2515 |
29582.1 |
31668.4 |
8895 |
30122 |
35521.4 |
1.00 |
1.10 |
1.21 |
47273.7 |
1191581.0 |
0.7461 |
35272.9 |
31821.5 |
8896 |
30123 |
17760.7 |
1.00 |
1.10 |
1.21 |
23636.9 |
732745.0 |
0.4940 |
11677.0 |
13763.2 |
Total |
|
79 422 102.0 |
|
|
|
92569865.8 |
102161911.0 |
|
102948677.6 |
102950428.1 |
* Calculated from non-response weights and population calibration adjusted base weights † Strata code contains divisional (two digits from left), residence (third digit from left), sex (fourth digit from left) and age group (last digit from right) codes ‡ Calculated by, base weight = 1/p1 x 1/p2 x 1/p3 x 1/p4, p1= primary sampling unit; p2=household; p3=sex randomization and p4=individual selection probabilities § PSU: primary sampling unit; HH: Household; Á Calculated by, Non-response adjusted base weight=base weight x non-responses weights (PSU x HH x Individual) ¶ Projected population of Bangladesh aged e”18 years is based on Census 2011(25) ** Population calibration factor = (projected population in a domain)/ (non-response adjusted weights in that domain) ††Population calibrated weight= Non-response adjusted weight x Population calibration factor ‡‡Trimmed weight: calculated after trimming any weight of population calibration adjusted weights beyond 3.5 times median weight (31821.53) and set at that level. The additional weights trimmed is then equally distributed among the non-trimmed weights. This is run twice till no weights were more than 3.5 times median weight.
Calculating the projected population from census data:
The total projected population calculated for adults aged 18 years or more is: 102 161 911. We accommodated for the change in division number from seven to eight (table II).25
Statistic |
Base weight* |
Untrimmed weights |
Population calibrated weight‡ |
Trimmed weight§ |
|---|---|---|---|---|
Mean |
10924.6 |
12733.1 |
14160.8 |
14161.0 |
Median |
8081.9 |
9440.1 |
9091.9 |
11178.1 |
Mode |
17741.5 |
20058.3 |
23189.2 |
31821.5 |
Standard Error |
130.4 |
153.9 |
186.8 |
112.6 |
Standard Deviation |
11118.5 |
13123.6 |
15928.7 |
9598.6 |
Sample Variance |
123620412.3 |
172228764.5 |
253723472.9 |
92132725.6 |
Minimum |
594.5 |
653.4 |
464.3 |
2550.5 |
Maximum |
210852.8 |
259127.8 |
261512.4 |
31837.4 |
Sum |
79422102 |
92569866 |
102948678 |
102950428 |
Percent differenceÁ |
77.7 |
90.6 |
100.8 |
100.8 |
95% confidence level |
255.6 |
301.7 |
366.2 |
220.7 |
Multiplicative effect¶(9) |
2.0 |
2.1 |
2.3 |
1.5 |
Population weight/ Calibration (r):
This is calculated in 160 domains: eight divisions, two residence strata, two sex strata and five age groups. In each of the domains the sum of projected population in that domain is divided by the non- response adjusted base weights of that domain. The mean ‘r’ was 1.33 (table II).
3. Calculating population calibration and non- response adjusted weight: This weight is the product of base weight; PSU, HH, and individual non-response factors; and population calibration factor. Here calculated adjusted weight was 102 948 678 (table II).
4. Trimming of weight: In our exercise, we trimmed the non-response and population calibration adjusted base weight. We identified the median of the non-response adjusted and population calibrated weight to be 9 091.9. All weights above and below the 3.5 times median(15)(16) value of 31 821.7 and was set at that value.15,16 We trimmed any weight above 31 821.7 and fixed the weight at that value (table III).
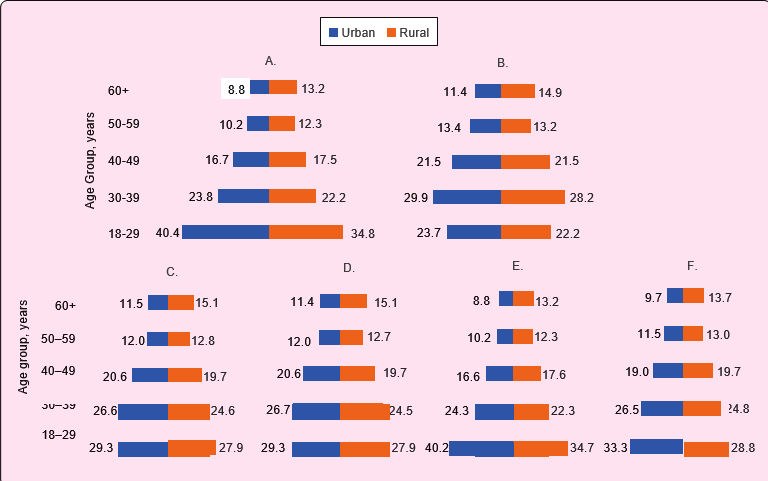
Comparing the calculated weights: A comparison was made between the distribution of the projected population with the unweighted sample to show the differences in distribution by age and residence. (figure 2A and B). It is shown that the unweighted sample distribution is not similar to the population distribution. However, when we make the same comparison with weighted distributions with any of the four calculated weights, it shows that the distribution closely matches with that of population. The best match was achieved by the sample distribution weighted with population calibrated and trimmed weights (Figure 2).
All the weights except the trimmed weight show a wide range denoting instability of the calculated weights. Sum of the calculated weights gradually increased from the base weight to the trimmed weights. The population calibrated weights and the trimmed weights thus stands at 100.8% of the projected population (table III). The distribution of the trimmed weight is more centrally oriented as is denoted by the difference between maximum and minimum, narrower standard error, confidence level than other weights. The multiplicative effect for the trimmed weight is 1.5 and the only weight which is less than 2.9 We also checked the effect on the different weights on the prevalence of mental disorders according to the NMHS 2019.11 The unweighted prevalence is 17.3%. Which is very close to the weighted prevalence (15.8%–16.8%). We also calculated the prevalence in urban-rural and male and female domains and found no notable difference. However, we observe that the prevalence of mental disorders tends to decrease from unweighted to weighted results. However, we think that this difference is negligible. We calculated the design effect of unweighted and weighted calculations. Though it is somewhat increased in the weighted results, we observe the lowest design effect for base weights (1.7) and trimmed weights (1.7) (table IV).Residence |
Unweighted |
Weighted |
|||
|---|---|---|---|---|---|
Base† |
Non-response |
Population |
Trimmed Á |
||
Overall |
17.0(16.1–18.0) |
16.8(15.5–18.1) |
16.8(15.4–18.1) |
15.8(14.5–17.1) |
16.2(15.1–17.3) |
Urban |
16.7(15.4–18.0) |
15.4(13.3–17.4) |
15.3(13.2–17.4) |
14.4(12.4–16.4) |
15.3(13.7–16.8) |
Rural |
17.4(15.9–18.8) |
17.2(15.6–18.7) |
17.2(15.6–18.8) |
16.3(14.7–17.9) |
16.6(15.1–18.0) |
Male |
15.0(13.7–16.2) |
13.8(12.2–15.5) |
13.7(12.1–15.4) |
12.5(10.9–14.1) |
13.2(11.9–14.6) |
Female |
18.9(17.7–20.2) |
19.4(17.8–21.1) |
19.5(17.8–21.2) |
18.8(17.1–20.6) |
18.8(17.4–20.3) |
Design effect¶(4) |
|
2.3 |
2.3 |
2.4 |
TrimmedÁ |
Discussion
We calculated four weights: base, non-response adjusted, population calibrated and trimmed weights using Microsoft Excel. We presented here the weighting process from a recently conducted NMHS 2019 and tested those for quality.9,11
It is claimed that weighting with base weight only is an efficient method as it is a simple one to construct.13,17 It may be completed after the mapping and listing activity before the data collection. It avoids the performing meticulous non-response calculations and the need for population projection estimation and calibration. Thus base weight can be used as the final weight for a survey when response rate is 90% or more.24 Otherwise, calculating a non-response and population calibration adjusted base weight is recommended.9 However, we generated all four weights despite survey response rate was acceptable and fresh census data unavailable.
In the NMHS Bangladesh 2019 data were collected though handheld computers and item non-response was absent.8 However, the weighting procedure corrected the sample distribution for unit non- response. The compared to the unweighted distribution of sample, the weighted distribution were more reflective of population distribution and size.
Despite the sampling design with equal allocation of PSUs to urban-rural and male-female strata, the calculated weights corrected the sample distribution for variables like sex, residence etc. to make it conform to the population by distribution and size achieving one of the prime objectives of the weighting exercise.3,15 The biasness induced by the design effect is also reduced by the small design effect in the weighted results.25 Small design effect will help to estimate a smaller required sample size for future studies which is much needed in a low-resource country.26
In addition, we calculated trimmed weights.15 Though some authors do not recommend this procedure as it might induce inaccurate results by introducing a small bias.14,27 However, it also greatly reduces standard errors.24 The disadvantage of weighting data is reduced precision to some extent.25 Some researchers worry about dealing with highly unequal weights which trimming might address thus improving precision.15 In our study, the trimmed weight was stable and provided a favorable result as suggested by others.14
We performed non-response adjustment without taking into account characteristics of each individuals rather than in a subgroup - a weakness noted by some authors.28 We also used a basic calibration procedure to achieve the population adjusted weight for performing the exercise in Microsoft Excel using simple statistical techniques.9 Despite recommendation of using expensive statistical software for weighting of data, we used the easily available and affordable Microsoft Excel for this exercise and generated weights through a simple step- by-step procedure. This has implications in increased applicability of weighting procedure for surveys to generate high-quality results in resource-limited setting like Bangladesh. We tested these weights for compensation of non- sampling errors, variability and accuracy, and compared with population distribution.9,13 It has been argued that even if weights reduce bias, they might largely inflate variance of estimates.29 Though we encountered a little loss of precision overall in the process if base weight is used, this is gradually removed when we use the other weights. The results calculated using the trimmed weight was the most precise. Except for the trimmed weight, other weights had wider values denoting instability. In our data we showed that trimming procedure generated a weight that stroke a good balance between instability and accuracy.30
Conclusion
Weighting compensated for the non-sampling errors and corrected the imperfections in the sample and prevented bias between the sample and the reference population in contrast to the unweighted sample. We found that the trimmed weight was the most acceptable among the four weights. The results generated by using the trimmed weights yields a more nationally representative, precise results and renders it comparable with other national data.
Acknowledgments
The authors gratefully acknowledge support of Mr AKM Tahidul Islam, Deputy Director, Bangladesh Bureau of Statistics, for population projection, based on Housing and Population Census of Bangladesh 2011. Unpublished works of National Institute of Mental Health used in this report have been done by investigators beyond the author list.
References
- Cochran WG. Sampling techniques [Internet]. Wiley; 1977 [cited 2020 Jan 25]. 428 p. Available From: www.wiley.com/en-bd/Sampling+ Techniques, +3rd+Edition-p-9780471162407
- Ridgeway G, Kovalchik SA, Griffin BA, Kabeto MU. Propensity Score Analysis with Survey Weighted Data. J Causal Inference [Internet]. 2015 Sep 1 [cited 2020 Aug 19];3:237–49.
Available From: www.ncbi. nlm.nih. gov/pmc/articles/ PMC5802372/ - Yansaneh IS. Household Sample Surveys in Developing and Transition Countries Chapter II Overview of sample design issues for household surveys in developing and transition countries [Internet]. 2005 [cited 2020 Jan 25]. 619 p. Available From: unstats.un.org/unsd/hhsurveys/pdf/ Household_surveys.pdf
- Bell BA, Onwuegbuzie AJ, Ferron JM, Jiao QG, Hibbard ST, Kromrey JD. Use of design effects and sample weights in complex health survey data: A review of published articles using data from 3 commonly used adolescent health surveys [Internet]. American Journal of Public Health. 2012; 120:1399-405. Available From: chrome-extension://dagcmk pagjlhakfd hnbomgmjdpkdklff/ enhanced-reader.html? pdf=https% 3A%2F% 2Fbrxt.mendeley. com%2Fcatalog% 2Fcontent% 2Fe3955679-9d86-3e6f-a0da-2ed8f3c68157
- Butar Butar F, Chang C. Weighting Methods in Survey Sampling Permutation method View project Weighting Methods in Survey Sampling [Internet]. 2012. Available From: www.researchgate.net/publication/313036499
- Brick JM. Unit Nonresponse and Weighting Adjustments: A Critical Review. J Off Stat [Internet]. 2013 Jun 1 [cited 2020 Sep 1];29:329–53. Available From: content.sciendo.com/doi/10.2478/ jos-2013-0026
- Satterlee E, Mccullough L, Dawson M, Cheung K. Paper to mobile data collection: a manual [Internet]. US Global Development Lab; 2020 [cited 2020 Aug 19]. p. 52. Available From: www.fhi360.org/sites/default/files/ media/documents/Paper_to_ Mobile_Data_ Collection_ Manual_ 1.0.pdf
- Lohr SL, Grove P, Belmont A. Sampling: Design and Analysis QP ® An International Thomson Publishing Company [Internet]. CA: Duxbury Press; 1999 [cited 2020 Jan 25]. 503. Available From: drive.uqu.edu.sa/_/maatia/files/ Sampling.pdf
- Global Adult Tobacco Survey Collaborative Group. Global Adult Tobacco Survey (GATS) GTSS Sample Weights Manual [Internet]. Altanta; 2010 [cited 2020 Jan 25]. 36 p. Available From: https://www.who.int/tobacco/surveillance/ 9_GATS_SampleWeightsManual_v2_FINAL_15Dec2010.pdf
- World Health Organization. WHO STEPS Surveillance Manual [Internet]. WHO; 2017 [cited 2020 Sep 1]. 472 p. Available From: www.who.int/ncds/surveillance/ steps/STEPS_Manual.pdf?ua=1
- National Institute of Mental Helath. National Mental Health Survey Bangladesh 2019 Provisional Fact Sheet (to be revised) [Internet]. Dhaka: NIMH; 2019. Available From: dghs.gov.bd/images/docs/Notice/ NIMH Fact Sheet final-5-11-19.pdf
- Lavallee P, Beaumont J-F. Why We Should Put Some Weight on Weights. Surv Methods Insights from F [Internet]. 2015 [cited 2020 Jan 25];1–18. Available From: surveyinsights.org/?p=6255
- Leeuw EDD, Hox J DD. International Handbook of Survey Methodology [Internet]. 1st ed. New York: Taylor and Francis; 2008 [cited 2020 Mar 12]. 560 p. Available From:
- Henry K, Valliant R. Methods for Adjusting Survey Weights When Estimating a Total [Internet]. [cited 2020 Aug 18]. Available From:
- Valliant R, Dever JA, Kreuter F. Practical tools for designing and weighting survey samples [Internet]. Pittzburg: Springer; 2013 [cited 2020 Jan 25]. 670 p. Available From: https://www.springer.com/gp/book/ 9781489993816
- Potter F, Zheng Y. Methods and Issues in Trimming Extreme Weights in Sample Surveys [Internet]. [cited 2020 May 3]. Available From: nces.ed.gov/nationsreportcard/tdw/ weighting/2008/ltt_weighting_2008_trimming_adju
- Hakim F, Bhuiyan R, Akter K, Zaman M. Weighting National Survey Data for Bangladeshi Population. SAGE Publications Ltd; 2020.
DOI:10.4135/9781529743623 - United Nations. Designing Household Survey Samples: Practical Guidelines [Internet]. New York; 2005 [cited 2020 Aug 19]. Available From: https://unstats.un.org/unsd/demographic/ sources/surveys/Handbook23June05.pdf
- Earp M, Haziza D. Comparison of weighting procedures in the presence of unit nonresponse: a simulation study based on data from the American Time Use Survey [Internet]. 2018 [cited 2020 Aug 19]. Available From: https://www.bls.gov/osmr/research- papers/2018/pdf/st180130.pdf
- Johnson DR. Using Weights in the Analysis of Survey Data [Internet]. Power point presentation. 2008 [cited 2020 Jan 25]. Available From: www.nyu.edu/ classes/jackson/ design.of.social.research/ Readings/Johnson - Introduction to survey weights %28PRI version%29.pdf
- Reig J. (Very) basic steps to weight a survey sample [Internet]. 2017 [cited 2020 Jan 25]. Available From: https://bookdown. org/jespasareig/ Book_How_to_ weight_a_ survey/
- Global Adult Tobacco Survey Collaborative Group. Global Adult Tobacco Survey (GATS) Sample Design Manual [Internet]. GA; 2010 [cited 2020 Sep 1]. Available From: https://www.who.int/tobacco/surveillance/ en_tfi_gats_sampledesignmanual_v2_final_03nov2010.pdf?ua=1
- Bangladesh Bureau of Statistics. Population-and-Housing- Census 2011 [Internet]. 2011 [cited 2020 Jan 25]. Available From: http://www.bbs.gov.bd/site/page/ 47856ad0-7e1c-4aab-bd78-892733bc06eb/Population- and-Housing-Census
- Mohadjer L. Sample Weights for Households with Multiphase Data Collection Approaches [Internet]. Maryland; 1999 [cited 2020 Jan 25]. Available From: https://www.stat.fi/isi99/proceedings/ arkisto/varasto/moha0259.pdf
- Lavrakas P. Encyclopedia of Survey Research Methods [Internet]. 2455 Teller Road, Thousand Oaks California 91320 United States of America: Sage Publications, Inc.; 2008. Available From: http://methods.sagepub.com/reference/ encyclopedia-of-survey-research-methods
- Salganik MJ. Variance Estimation, Design Effects, and Sample Size Calculations for Respondent-Driven Sampling. J Urban Heal Bull New York Acad Med [Internet]. [cited 2020 Aug 19];83(7). Available From: www. ncbi.nlm.nih. gov/pmc/ articles/PMC1705515/pdf/11524_2006_Article_9106.pdf
- Lee BK, Lessler J, Stuart EA. Weight Trimming and Propensity Score Weighting. PLoS One [Internet]. 2011 [cited 2020 Aug 19];6(3):18174. Available From: hjournals. plos.org/plosone/ article?id=10.1371/journal. pone.0018174
- Lee S. Propensity Score Adjustment as a Weighting Scheme for Volunteer Panel Web Surveys [Internet]. [cited 2020 Aug 19]. Available From: https://www. semanticscholar.org/paper/ Propensity-score-adjustment-as-a-weighting-scheme-Lee/ f8a5b 29054d189a6ba 9ccc2676555 344eb391c60
- Organisation for Economic Co-operation and Development. Survey weighting and the calculation of sampling variance [Internet]. Paris; 2015 [cited 2020 May 4]. Available From: www.oecd.org/pisa/sitedocument/ PISA-2015- Technical-Report-Chapter-8-Survey-Weighting.pdf
- Allen M. The SAGE Encyclopedia of Communication Research Methods [Internet]. SAG E Publications I, editor. 2455 Teller Road, Thousand Oaks California 91320: SAGE Publications, Inc; 2017. Available From: us.sagepub.com/en-us/nam/the-sage-encyclopedia-of-communication-research-methods/book244974
Research & Publication, World Health Organization Bangladesh, Road No.-8, House No. SW(1) 1/A, Gulshan-1, Dhaka-1212.
zamanm@who.int
 0000-0002-1736-1342
Submission
07 September 2020
Accepted
30 June 2021
Published
01 August 2021
Apply citation style format of Bangladesh Medical Research Council
Issue
Vol 47 No 2 (2021)
Section
Research Articles
Financial Support
No fund was required
Conflict of Interest
Authors declare that they have no competing interests.